Agricultural Drought Risk Assessment Description#
Climate change is posing an increasing threat to food production systems, furtherly complicating the challenge of satisfying the food demand of a rising global population while respecting the limits imposed by planetary resource boundaries. In Europe, the effects of climate change differ between historically semi-arid (e.g., Mediterranean) and wet (e.g., Central and North Europe) regions. In the former, while rainfall events will become less frequent and more extreme, droughts will get more severe and extend beyond the historical dry seasons, compromising the long-term stability of freshwater resources. At the same time, higher latitudes will experience a significant reduction in mean precipitation rates that, coupled with increasing mean temperatures, will negatively affect soil water availability. These climatic shifts have profound consequences for the agricultural sector. On one hand, semi-arid regions will be increasingly prone to water shortages and forced to reduce allocations to irrigation to satisfy other public needs. On the other, historically wet regions might be forced to invest in the large-scale expansion of their irrigation systems, as the decreasing water availability will hinder the potential of rainfed systems to satisfy growing production demands. In this context, a transition towards more water-stress-resilient agricultural practices is urgently needed to limit losses across the european food production system.
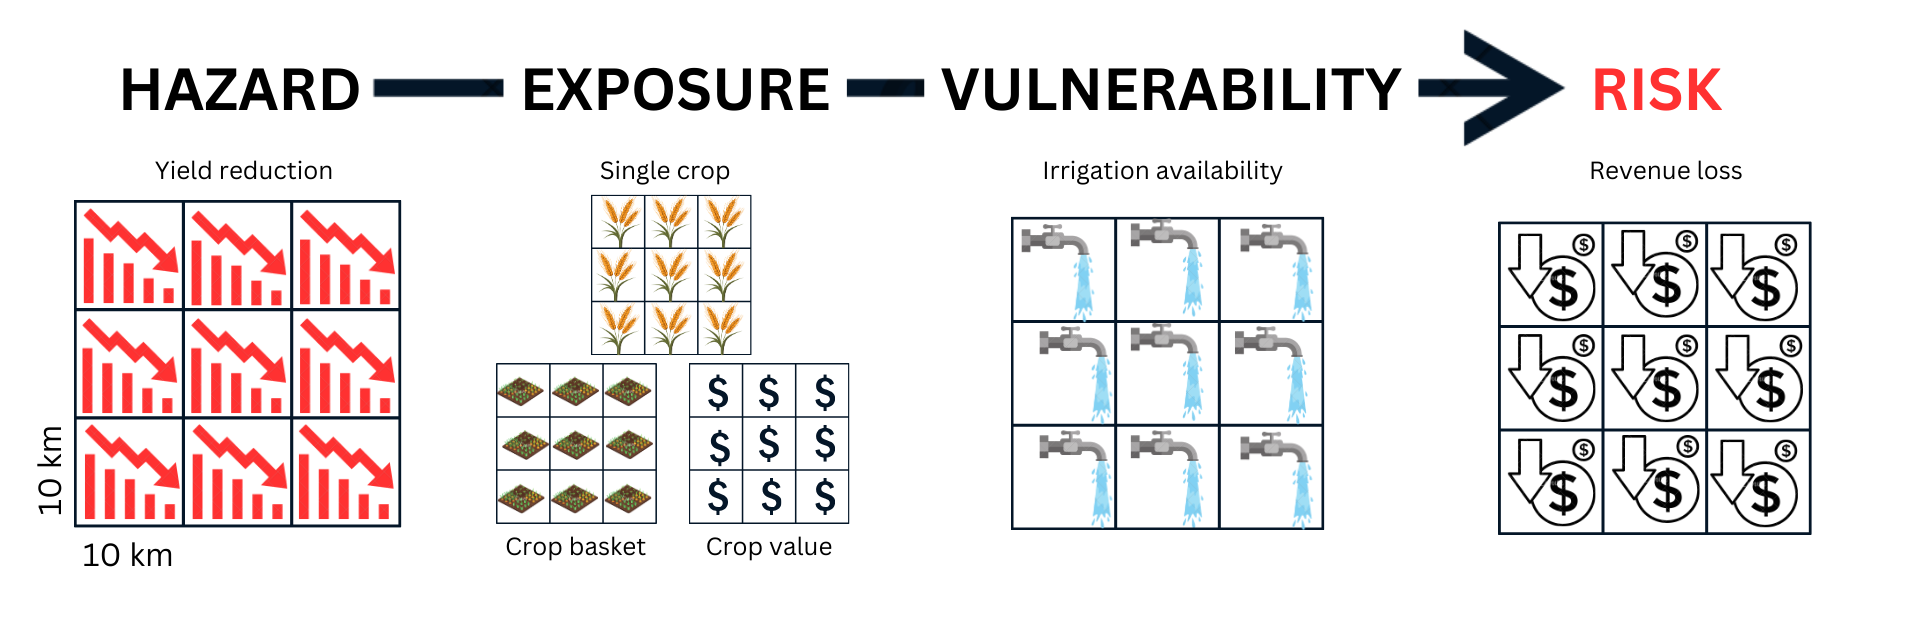
Indeed, risk quantification is a fundamental first step in the design of an effective adaptation strategy. Thus, the aim of this workflow is to provide a simple tool to quantify potential agricultural revenue losses caused by precipitation deficit. The hazard component of the asssessment is represented by the potential yield losses deriving from water scarcity, defined as the deficit in crop evapotranspiration potential, in the absence of irrigation. The total crop production and the aggregated crops revenue are used to quantify the exposure of the agricultural sector in economic terms. Finally, the current distribution of irrigation systems is used to map vulnerability. Thus, using this tool communities will get a spatial quantification of potential revenue losses from reduced crop production, and will also be able to identify the most vulnerable areas to precipitation deficits. In stricter terms, the revenue loss quantified here represents the ‘lost opportunity’ cost of non implementing irrigation.
Structure of the workflow#
This workflow consists of two separate notebooks, one for the hazard assessment and one for the risk assessment. In addition, the user is provided with the editable CSV file containing the parameters used for crop modeling.
In the next pages you will find:
CSV file with the crop parameters (link to file on GitHub) and the related notebook describing the parameters choice
Datasets used#
The assessment is based on well-established climate projections and global agricultural datasets allowing to estimate potential losses at approximately 10 km resolution. These include:
Climate data (daily mean precipitation flux, maximum and minimum temperature, 2 m relative humidity, surface downward solar radiation and 10 m wind speed) from CORDEX regional climate models, as well as data on soil available water capacity (Hengl and Gupta, 2019), elevation (Danielson & Gesch, 2011) and thermal climate zone (Van Velthuizen et al., 2007) will be used to calculate the hazard (i.e., the potential yield loss).
Global production [ton] for a selection of crops in 2020 from the MapSPAM repository (International Food Policy Research Institute, 2019) and crop aggregated value [US$] from the FAO-IIASA Global Agro-Ecological Zones data repository (GAEZ) will be used to determine the exposure of different crops to precipitation scarcity.
Distribution of fully-irrigated cropland for 2015 from GAEZ to account for vulnerability.
The tool is designed to work considering different future time periods and emission scenarios, allowing the user to understand the implications of different levels of global warming. The user is invited to further personalise the workflow using local datasets for agricultural production to increase the accuracy of the assessment or to test the reliability of the default global datasets.
Outputs#
The output of the workflow is a map showing the potential revenue losses from irrigation deficit in the studied region for the studied crops, emission scenario and future period. Losses are expressed as the ‘lost opportunity cost’ in thousands euros if crops are grown under non-irrigated conditions. The maps also show the share of cropland in each grid-point with irrigation systems already implemented in 2015 as an indicator of vulnerability to rainfall scarcity.
The map can be used by demonstrators to understand which areas of their region are expected to suffer the greatest losses, as well as which crops will be the most impacted by the absence of irrigation. This allows them to target adaptation efforts, such as the improvement of the current irrigation network, in the most affected and vulnerable areas favouring a cost-effective use of resources. At the same time, the map provides a snap-shot of a potential future growing season that can be used to guide cropland expansion towards areas and products less affected by water stress.
Limitations#
The main limitation of this approach is that the crop production and aggregated value datasets refer to 2020 values and the irrigation distribution dataset 2015. These values might not accurately represent current conditions. The user is invited to replace these datasets with more updated information whenever possible.
From a methodological point of view, the main limitation derives from the yield loss calculation procedure, as discussed in detail the hazard workflow. In essence, the accuracy of the yield loss calculation is limited by the global parameters used in the crop growth modelling part of the workflow. The user can improve the accuracy of the assessment using locally-relevant parameters whenever possible.
Contributors#
Euro-Mediterranean Center on Climate Change (CMCC), Italy.
Author of the workflow: Andrea Rivosecchi