Extreme Precipitation: Local data requirements and interpretation for climate risk assessment#
As explained in the introduction section, the frequency and magnitude of extreme precipitation events are likely to vary under the premises of climate change scenarios. These projected changes can translate to an increase in the frequency and magnitude of pluvial floods [urban and flash floods] resulting from the precipitation intensity exceeding the critical impact rainfall thresholds of natural and artificial drainage systems capacities.
The extreme precipitation workflow has been constructed to guide users, communities, and regions in understanding how their current critical impact rainfall thresholds will be affected by climate change. The following section will walk you through learning more about what are impact rainfall thresholds, the local knowledge to derive them, and a summary of the basic information needed to start executing the extreme precipitation workflow
What are critical impact rainfall thresholds?#
Impact rainfall thresholds are defined as the precipitation required within a specific timeframe to trigger various impacts, such as urban flooding in vulnerable areas or sites (e.g., low-lying). Additionally, these are commonly used in designing civil works like road drainage systems and flood protection infrastructure and serve as decision support values for early warning systems (Meléndez-Landaverde & Sempere-Torres, 2022). Hence, impact rainfall thresholds serve as key indicators, helping link local potential risk and its consequences to specific rainfall intensity values.
In this context, a critical impact rainfall threshold is defined as the precipitation necessary to trigger unsustainable or unacceptable impacts. As seen in figure 1, this concept is closely related to the “risk-tolerance level”, defined as the maximum amount of loss, impact, or frequency that areas, communities, and regions are prepared to handle due to climate hazards, or in this case, extreme precipitation. Consequently, these naturally vary across communities and sectors (e.g., transportation or agriculture) as risk is not absolute but a social construct that depends on the local context, the coping capacity, and risk perception.
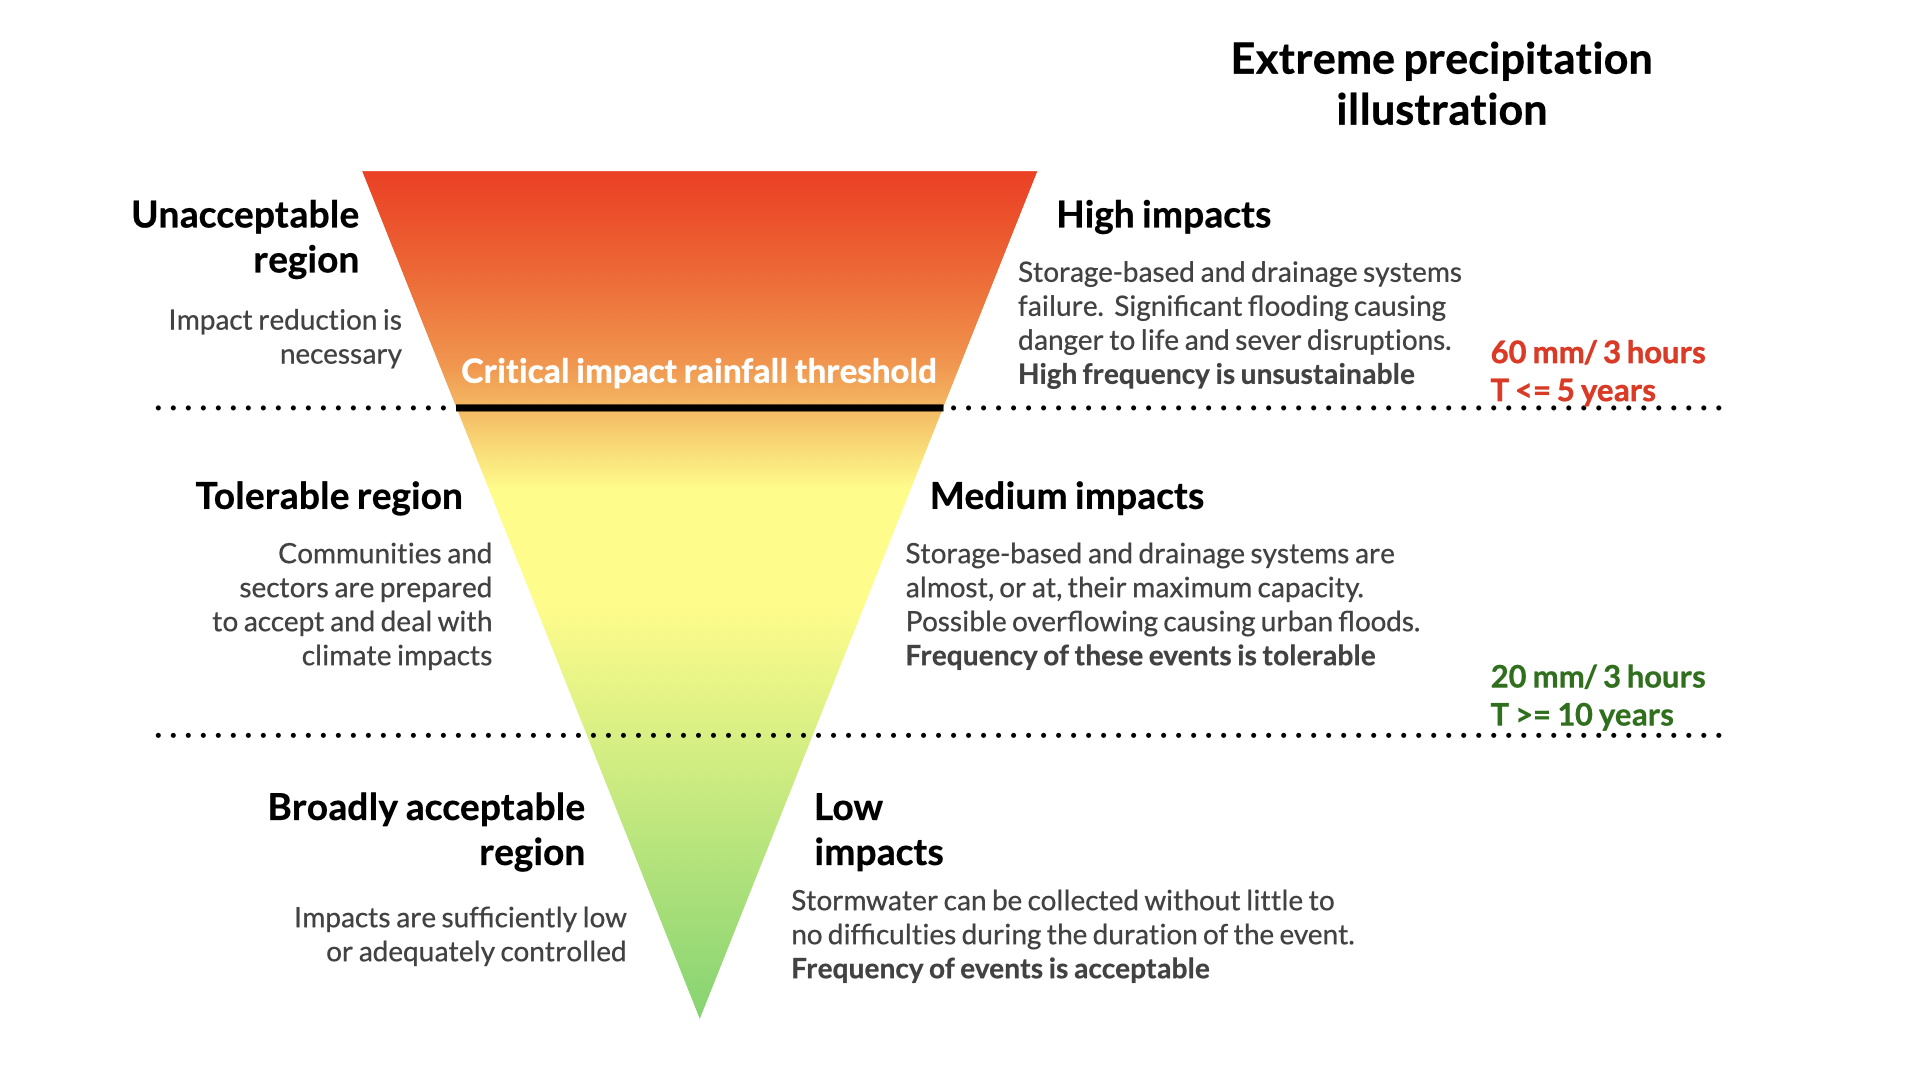 Figure 1. Risk Tolerance level and critical impact-based rainfall thresholds - an example.
By clearly defining impact and critical rainfall thresholds based on their tolerance levels, communities, and sectors can proactively develop metrics for climate risk assessment, design appropriate adaptation measures, and enhance their overall resilience.
Developing Impact-based Rainfall Thresholds: A guide#
The aim is to define our impact-based rainfall thresholds in terms of Magnitude (mm), Duration (hours) and Frequency (years). The following guide will help you identify these thresholds for your location or region.
Step 1: Hazard and impact data collection#
This step is crucial as it provides a solid foundation to identify what kinds of risks a region, city or neighbourhood are facing and how they have affected them in the past. Different approaches exist to develop hazard-impact databases; however, they all involve the integration of hazard, exposure, and vulnerability data from scientific and local knowledge sources. Below are some examples of hazard and impact data collection:
Local sources: Local newspapers, TV reports, and insurance records can help uncover details about past precipitation events and their impacts.
Reach out to emergency responders and official authorities: The primary source for verified incident and damage reports for understanding the true impact of precipitation events
Social media monitoring for real-time and post-hazard impact information
Crowdsourcing campaigns via mobile apps or social media
Traffic analytics based on Internet of Things devices.
Remember, the goal of this step is to gather as much local data as possible on past rainfall events, the hydrometeorological parameters observed, such as intensities or weather radar), and the impacts triggered in the area.
Step 2: Create hazard-impact databases#
The information collected in step one can be used to develop hazard-impact databases. These can be a key source of information to help communities organise and understand the risks they face and their impacts. The database configuration is flexible and based on the impact and hazard criteria most relevant for the area and users. However, they traditionally include the following sections for previous rainfall events:
Hazard Data: This section includes information on hydrometeorological parameters such as rainfall accumulations for different directions (e.g., mm/24 hours), the return periods associated with these intensities - more on that in step 3 - and the total duration of each rainfall event
Impact categories: It involves the categorisation of previously experienced impacts in an event into key areas:
Risk to people: Information on evacuations, rescue activities, injuries or fatalities reported in an area or specific location
Damage to buildings
Disruption to traffic: Road closures, traffic or transportation disruption
Others, that encompass emergency information (e.g., number 112 calls) and complementary data (e.g., insurance claims, official warnings triggered, and impact description)
A table listing all previous events can be created using these sections, with each entry including descriptive information on both hazard and impact. Structuring the hazard-impact data in this format can create a clear image of past events and their effects on communities or regions. See the table below for an illustrative example of a hazard-impact database.
| Date | Accumulations registered (mm/hrs) | General description | Risk to people | Damage to buildings | Disruption of transport | Others or Comments |
|---|---|---|---|---|---|---|
| 22-23th October 2019 |
|
Event causing widespread flooding in the community | Several people were trapped inside their vehicles. They had to be rescued by authorities | Underground parking lots and lower floors were flooded | Main roads had to be closed due to surface flooding | 140 calls to the 112 around noon. The majority of localised flooding and rescue activities |
Step 3: Exploring local rainfall patterns (frequency analysis)#
Understanding how often an extreme precipitation event can occur is key to effective planning. The magnitude of an extreme precipitation event is inversely related to its frequency of occurrence. This means that the more extreme an event is, the less often it happens, but will this change in the future? First, we need to identify our current frequencies!
In this context, What is a local rainfall frequency analysis? Its objective is to link the magnitude of precipitation events for specific durations (e.g., millimetres in 24 hours) to their frequency of occurrence in terms of return periods. In simpler terms, return periods are how often we can expect a rainfall event with a particular magnitude to happen. As an illustrative example, a 10-year return period associated with 100 mm/24 hours means we can expect that rainfall magnitude about once every 10 years on average. However, please keep in mind that this doesn’t mean it only happens every 10 years—it’s just an average, and we can experience multiple “10-year” events in a single year! The results of a rainfall frequency analysis can be used for many engineering purposes, such as designing drainage systems, and flood control structures or identifying rainfall warning thresholds.
Fortunately, most regions and municipalities already have official rainfall frequency analysis data (i.e., return periods) for their area. Usually, this process involves collecting previous rainfall data from local rain gauge stations, preprocessing, and performing a frequency analysis by fitting a probability distribution function to the annual maximum rainfall series of a specific duration.
For this step, it is recommended that the study or dataset with the area’s official return periods be identified (see the example of Catalonia here). If unavailable, do not worry! You can refer to the extreme precipitation hazard workflow for guidance on deriving your area’s return periods.
Once the dataset has been identified or the local rainfall frequency analysis has been developed, the local return periods can be integrated into the hazard-impact table created in Step 2. For each event, cross-reference the observed intensities (i.e., mm/24 hours) to the official return periods, or in other words, match up how intense a precipitation event was with how often it is expected to happen in the area.
This process allows us to contextualise previously identified precipitation events and their categorised impacts in terms of observed rainfall accumulation and frequency of occurrence. See the table below as an illustrative example of an event, the accumulations registered, and the associated return periods (as T)
| Date | Accumulations registered (mm/hrs) | Return periods associated |
|---|---|---|
| 22-23th October 2019 |
|
|
Step 4: Impact evaluation#
Now that the hazard-impact database has been constructed, we can evaluate the impacts experienced in each event. Step 4 focuses on evaluating and categorising on a severity three-level scale (i.e., low, medium, and high impact) the impacts observed in all the events listed in the table of step 3. Here is a basic guide on how to perform the evaluation:
Reviewing events: Go through each rainfall event listed in the database from step 3 and examine the impacts these have caused in the area of interest.
Categorising in terms of impact severity: Assess the severity of these impacts and classify them as low, medium or high while considering factors such as the extent of damage, disruptions to daily life, risk to citizens, and others included in the impact categories of the table in step 3.
It is important to note that:
This evaluation involves a degree of subjective expert judgment. However, your local knowledge or those of local stakeholders, authorities and responders can support assessing the acceptable levels of risk for the community and provide vulnerability details on local vulnerabilities.
Since the evaluation is tailored to local vulnerabilities, steps 2-4 need to be repeated for each city and specific location. Risk levels can vary across different parts of a community, so it is crucial to assess impacts at a local and specific level
The result of this step is the classification of each event in the hazard-impact database based on the severity of the triggered impacts (e.g., the 16th of August is considered a high-impact event). See the table below for an illustrative example of a hazard-impact database classified by impact severity where T equals the return period.
| Date | Accumulations registered (mm/hrs) | Return periods associated | General description | Risk to people | Damage to buildings | Disruption of transport | Others or Comments | Impact severity scale |
|---|---|---|---|---|---|---|---|---|
| 22-23th October 2019 |
|
|
Event causing widespread flooding in the community | Several people were trapped inside their vehicles. They had to be rescued by authorities | Underground parking lots and lower floors were flooded | Main roads had to be closed due to surface flooding | 140 calls to the 112 around noon. The majority of localised flooding and rescue activities | High impact (3) |
Step 5: Derive critical impact-based rainfall thresholds and advisory tables#
Now that we have assessed the impact severity of past events, we can derive critical impact-based rainfall thresholds. This process involves two basic steps:
Analyse each event classified per impact severity: Examine the impact levels established in step 4 to identify patterns and correlations between the rainfall intensity recorded (or other hydrometeorological parameters included in Table 3) and the resulting impacts. This step can help to pinpoint critical thresholds beyond which impacts escalate significantly (e.g., high-impact level)
Derive rainfall thresholds: Using the information gained from the previous step, establish critical rainfall thresholds per impact severity level. These are established under the assumption that the impact severity level seen on the previously classified events can be expected once these thresholds are exceeded in rainfall events.
See the table below as an illustrative example of the critical impact-based rainfall thresholds defined in terms of Magnitude, Duration and Frequency.
| Location | Low impact | Medium impact | High impact | |||
|---|---|---|---|---|---|---|
| City level | Impacts | Thresholds | Impacts | Thresholds | Impacts | Thresholds |
| Small and isolated flooding of lands and flood prone areas |
|
Localised flooding of lands and roads causing possible danger to life due to fast flowing water and overtopping. Disruption of travel time is expected |
|
Widespread flooding of lands and roads causing danger to life due to fast flowing water and overtopping. Evacuations and rescue actions may be required |
|
|
These thresholds are determined by analysing past impacts and considering current vulnerabilities, exposure levels, and local capacity to cope. If any of these factors undergo significant changes (like implementing adaptation measures or altering the landscape), it’s crucial to reassess these thresholds. A good practice is to evaluate how well these thresholds perform after each rainy season, especially if severe impacts are reported in the area.
Changes in local critical impact rainfall thresholds under climate change: Magnitude and frequency#
As seen in figure 2, the extreme rainfall climate data computed in this workflow provide some insight into how current critical rainfall thresholds associated with impacts or for local physical measures, such as urban rainfall retention basins, reservoirs, low points, and urban drainage systems, will be exceeded (or not) in terms of Magnitude (e.g., intensity) and frequency (e.g., return periods) due to climate change.
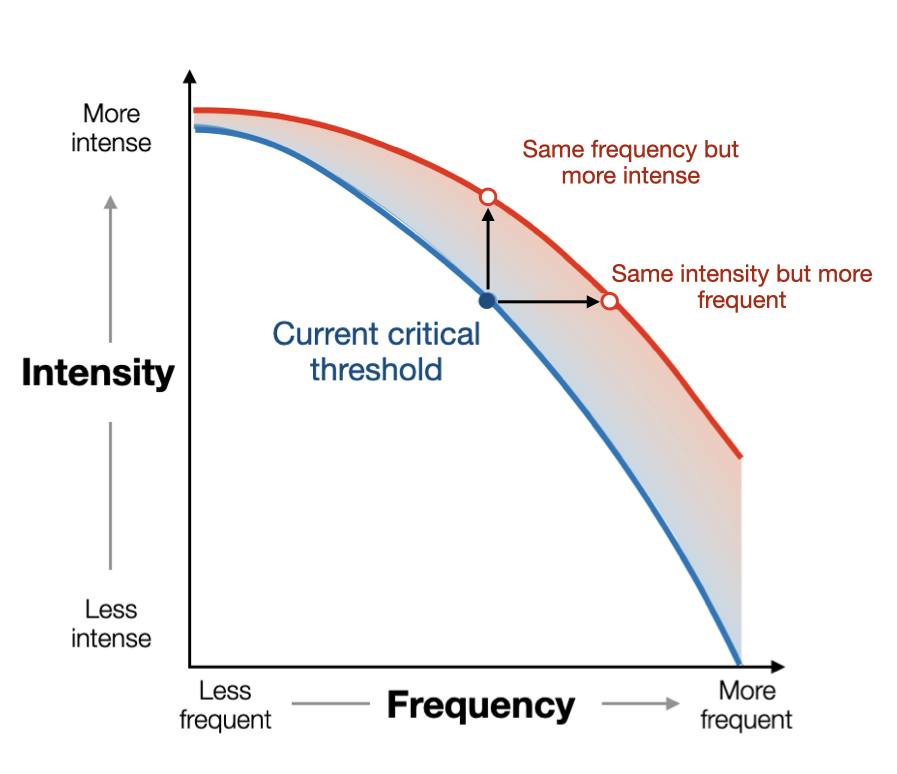 Figure 2. Possible changes in critical thresholds (Adapted from Seneviratne et. al., 2021)
By understanding how these critical thresholds will fluctuate locally, communities can make informed decisions about the most appropriate long-term adaptation measures to decrease the potential negative consequences. These can include increasing the capacity of water collection systems, updating their early warning systems, or developing awareness campaigns on more frequent extreme precipitation events. The result is a more comprehensive and encompassing local risk assessment and strategies for adapting to the challenges posed by climate change.
We encourage you to identify your critical rainfall thresholds and explore how these will evolve under climate change scenarios by using the hazard and risk sections of this workflow
You have your critical thresholds, now what?#
You’ve identified your critical thresholds—great! Now, let’s explore what to do next. There are two possible paths for you to follow:
Path A: Let’s jump straight into a climate risk assessment!#
If you prefer not to generate new rainfall datasets, use one of the pre-calculated European datasets provided in this workflow. These datasets have been computed using the same methodology as the Hazard Assessment, which involves EURO-CORDEX climate projections and extreme value analysis.
The combinations available are:
| Attribute | Non-bias corrected datasets | Bias-corrected datasets |
|---|---|---|
| Global and Regional Climate Model Chains |
ichec-ec-earth/knmi-racmo22e mohc-hadgem2-es/knmi-racmo22e mpi-m-mpi-esm-lr/smhi-rca4 |
ec-earth/racmo22e hadgem2-es/racmo22e mpi-esm-lr/rca4 |
| Representative Concentration Pathway (RCP) |
rcp 4.5 rcp 8.5 |
rcp 4.5 rcp 8.5 |
| Historical Time-frames |
1951-1980 1971-2000 1976-2005 |
1971-2000 1976-2005 |
| Future Time-frames |
2011-2040 2041-2070 2071-2100 |
2011-2040 2041-2070 2071-2100 |
| Durations |
3h 24h |
24h |
In this path, you will follow the steps outlined in the “Extreme precipitation: Changes under climate scenarios workflow [Risk assessment]” section. You will use the pre-calculated datasets to characterise how your critical impact-based rainfall thresholds are expected to change under climate change scenarios in your area of interest. By choosing Path A, you can focus directly on assessing how these climate projections impact your identified critical thresholds and associated risks while profiting from existing data resources.
Path B: Let’s start from scratch#
If you prefer to customise your climate risk assessment based on specific regional assessments or national guidance, we got you covered! Here is how you should proceed:
Refer to the “Extreme precipitation: Changes under climate scenarios workflow [Hazard assessment]” to generate your current and future rainfall datasets using the climate scenario or Global/Regional combination that best fits your regional context. The flexible steps can accommodate different datasets, allowing customisation to meet your individual needs.
Once the rainfall datasets of your area have been calculated, you can start the “Extreme precipitation: Changes under climate scenarios workflow [Risk assessment]”.
By opting for Path B, you can customise your climate risk assessment based on your local conditions and requirements.
Finally, the last section of the workflow “Extreme precipitation: Examples on how to carry out a climate risk assessment” presents real examples of applying these steps to European regions. Feel free to explore and adapt them to your research needs!
References#
Meléndez-Landaverde, E., Sempere-Torres, D. (2022) Design and evaluation of community and impact-based flood warnings: The SS-EWS framework. Journal of Flood Risk Management, e12860. https://doi.org/10.1111/jfr3.12860
Seneviratne, S.I., X. Zhang, M. Adnan, W. Badi, C. Dereczynski, A. Di Luca, S. Ghosh, I. Iskandar, J. Kossin, S. Lewis, F. Otto, I. Pinto, M. Satoh, S.M. Vicente-Serrano, M. Wehner, and B. Zhou, 2021: Weather and Climate Extreme Events in a Changing Climate. In Climate Change 2021: The Physical Science Basis. Contribution of Working Group I to the Sixth Assessment Report of the Intergovernmental Panel on Climate Change[Masson-Delmotte, V., P. Zhai, A. Pirani, S.L. Connors, C. Péan, S. Berger, N. Caud, Y. Chen, L. Goldfarb, M.I. Gomis, M. Huang, K. Leitzell, E. Lonnoy, J.B.R. Matthews, T.K. Maycock, T. Waterfield, O. Yelekçi, R. Yu, and B. Zhou (eds.)]. Cambridge University Press, Cambridge, United Kingdom and New York, NY, USA, pp. 1513–1766, doi: 10.1017/9781009157896.013.