Vulnerability curves#
When assessing damages, next to the value of the assets it is also important to find how vulnerable an asset is to a certain hazard. One way to do this is by identifying vulnerability curves. These curves relate a hazard intensity to a fraction of the maximum damages that occurs under this hazard intensity.
Here, we elaborate on vulnerability curves for floods and windstorms.
 Floods#
For flood damages, Huizinga et al. (2017) quantified depth-damage curves across the world (Fig. 50). These depth-damage curves relate the water depth during a flood event to a fraction of the building that is damaged. This fraction is multiplied by the found maximum damage of a certain asset. The authors have six classes of assets: residential, commercial, industrial, agriculture, transport, and infrastructure – roads.
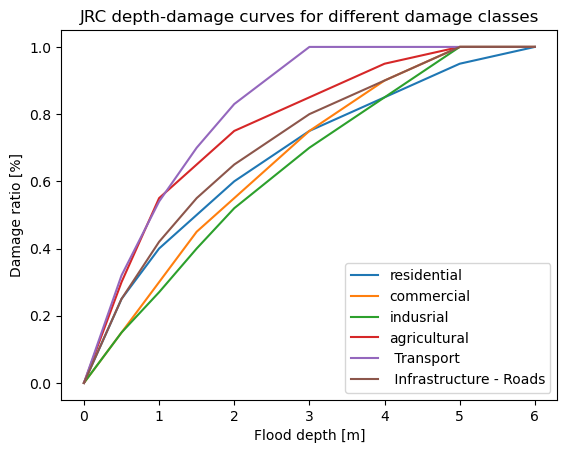
Fig. 50 Flood vulnerability curves as found by Huizinga et al. (2017) and used by the JRC#
Raster-based land use data may not contain information on the distribution of damage classes within the land use class. This will then need to be estimated by the stakeholder per land-use class. These proportions can then be used to create a new depth-damage curve that considers the proportions of buildings in the land use cell. See the formula below.
Where:
\(c_{new}\ (m)\) = the new curve for the land use class as a function of inundation depth
\(m\) = inundation depth
\(R_{cn}\) = ratio of class type in the specific landuse cell that should have curve n
\(c_n\ (m)\) = curve for asset type n as a function of inundation depth
 Wind#
Wind#
For wind, the vulnerability curves are based on the construction type of a building. Some structures are more resilient than others. For example, wooden sheds are easier to be damaged by wind than concrete buildings. Using the selection of Feuerstein et al. (2011) six vulnerability curves can be differentiated.
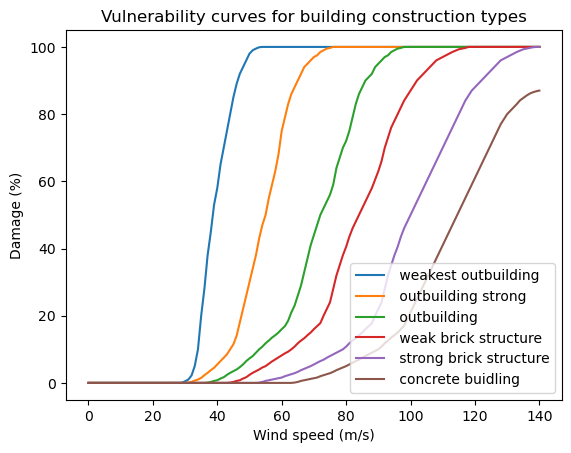
Fig. 51 Vulnerability curves as found by Feuerstein et al. (2011).#
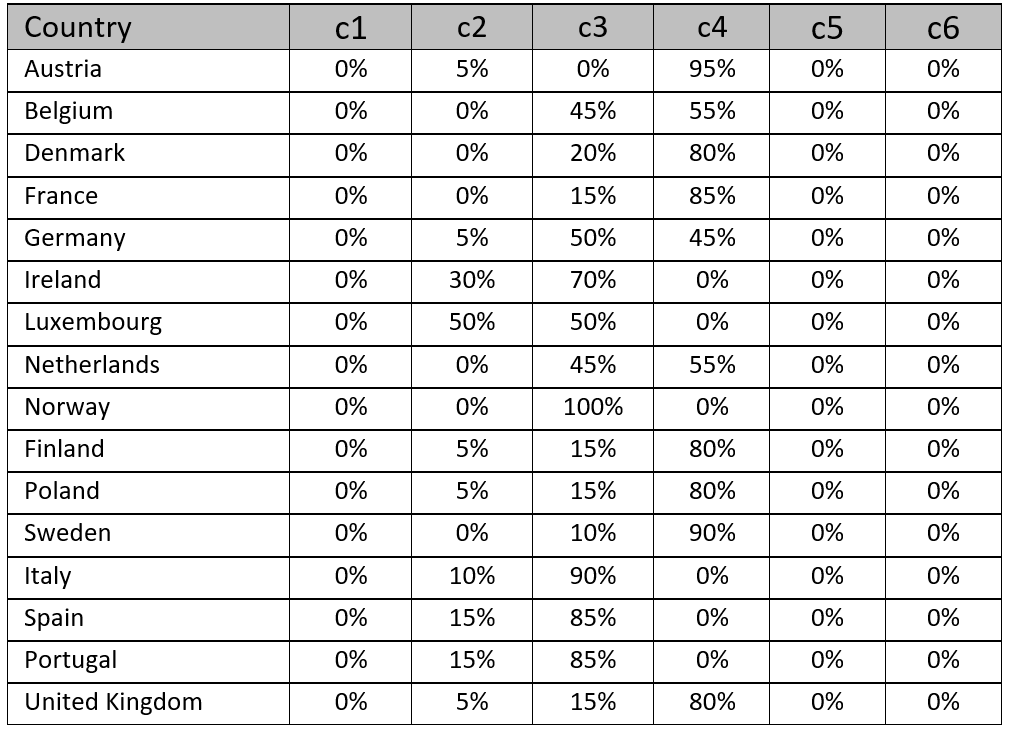
Land use data contains no information on specific building types and this needs to be estimated by the stakeholder per land use class. However, as a first estimation, the PAGER database is used by (Koks & Haer., 2020) and a table is given here. to identify the proportion of building types per land use. These proportions can then be used to create a new curve that considers the proportions of buildings in the land use cell.
Where:
\(c_{new}\ (w)\) = the new curve for the land use class as a function of windspeed
\(w\) = 3-second windgust in \(m/s\)
\(R_{cn}\) = ratio of class type in the specific landuse cell that should have curve n
\(c_n\ (w)\) = curve for building type n as a function of windspeed
Curve ratios of Koks & Haer (2020)
Curve ratios identified per country that result in damage values similar to losses from other models (Koks & Haer, 2020):
References#
Feuerstein, B., Groenemeijer, P., Dirksen, E., Hubrig, M., Holzer, A. M., & Dotzek, N. (2011). Towards an improved wind speed scale and damage description adapted for Central Europe. Atmospheric Research, 100(4), 547-564. doi: 10.1016/j.atmosres.2010.12.026
Huizinga, J., De Moel, H. and Szewczyk, W. (2017). Global flood depth-damage functions: Methodology and the database with guidelines. EUR 28552 EN, Publications Office of the European Union, Luxembourg. ISBN 978-92-79-67781-6, doi:10.2760/16510, JRC105688.
Koks, E. E., & Haer, T. (2020). A high-resolution wind damage model for Europe. Scientific reports, 10(1), 6866. doi: 10.1038/s41598-020-63580-w