River flooding#
Workflow for risk assessment under climate scenarios#
This workflow is designed to help in exploring the regional risks presented by fluvial flooding (river flooding) and assessing the impact of climate change on these risks.
Fluvial flooding is caused by high water levels in the river bodies which are in turn caused primarily by heavy or long-lasting precipitation upstream of the impacted area. Under climate change, precipitation extremes are expected to increase in many European regions, which will likely lead to an increased risk of fluvial flooding. In this workflow we explore an example of how the risk presented by fluvial flooding can be assessed by calculating economic damages in the given area. We do this based on European-scale river flood maps. The methodology for assessing river flood hazard and risk is described below.
Risk assessment methodology#
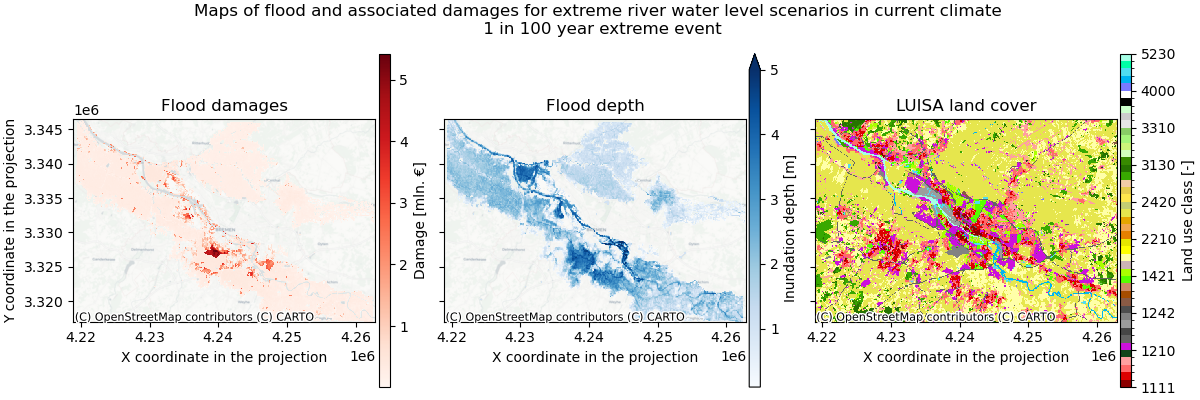
In this workflow flood risk is calculated by combining a set of maps of river flood extent for a number of different flood return periods with exposure and vulnerability data. The exposure and vulnerability data is presented in the form of economic damage functions for infrastructure.
Flood damage is calculated by combining depth-damage curves with maps of inundation depth. For each grid point, the damage is calculated by combining the flood depth, land use type, damage curves, and economic country-specific parameters that approximate the economic value of different land use types.
The resulting data and maps help the user to assess the hotspots of potential economic damage due to river flooding for different return periods of high river flows.
Note
Return period is the average number of years for events of a particular magnitude to be repeated or exceeded.
Datasets used in the risk assessment#
The following datasets are used to calculate damages due to flooding:
River flood depth maps, available from the Joint Research Centre for different return periods.
The land use map is available from the Copernicus Land Monitoring Service.
Flood-damage curves for infrastructure expressed as relative damage percentage, available from JRC.
The economic value for different types of land use, which can be country/location specific. This data is specified in a separate Excel file, which is linked to in the risk assessment notebook.
Which flood maps to use in the risk assessment?#
In this workflow we include an example of performing a risk assessment using the river flood hazard maps for Europe available from the Joint Research Centre. If you would like to use these maps, please first use the hazard assessment notebook to retrieve and prepare the data (see below for the overview of notebooks in this workflow). More information on these river flood maps is given below (see river flood maps for historical climate).
The Europe-wide dataset of river floods provides a consistent overview of river flood hazard for all regions, but it has several important limitations. The dataset only includes large river basins (larger than 150km2) and does not include flood protections, which can lead to unrealistic flood maps in some regions. In addition the underlying river model does not include any water management. Therefore, it is important to always check the result against existing local knowledge of the infrastructure.
We encourage the users to use their own flood maps in this workflow, if such maps are available and deemed more representative for the region. For a more accurate estimate of river flood risks, it is recommended to perform local flood modelling, possibly by taking the results of the global model as boundary conditions. Local models can take better account of complex topography, and one can incorporate local data and knowledge about e.g. flood protection measures.
Especially for (urban) flash floods the dataset is not detailed enough. For flash floods we advise the use of higher resolution local flood inundation models that include a realistic schematization of flood defenses and drainage infrastructure. In addition, we advise to rather simulated precipitation event i.s.o. continuous datasets. The heavy precipitation events for given return periods can be obtained from the HEAVY RAINFALL (extreme precipitation) workflow.
Hazard assessment methodology#
To assess the future river flood hazard, we use two different datasets:
High-resolution modelled river flood hazard maps for Europe under historical climate from JRC.
Coarse-resolution future river flood hazard maps under climate scenarios from Aqueduct Floods.
River flood maps for historical climate#
The high-resolution river flood maps from JRC come at a spatial resolution of 3 arc-seconds (30-75m in Europe depending on latitude). Flood maps are available for various return periods (10, 20, 30, 40, 50, 75, 100, 200, 500 years).
The methodology behind this dataset is documented and can be accessed through this article. We will use the most recently updated version of the dataset (v3) that became available in March 2024.
This dataset allows to compare the flood maps between different return periods, but it does not contain information about how these flood maps would change under the climate scenarios.
The dataset only includes the river basins larger than 150km2. The flood modelling in this dataset does not account for man-made protections that may already be in place in populated regions (e.g. dams, levees, dikes). Therefore, it is always important to survey the local circumstances when interpreting the flood maps.
River flood maps for future climate scenarios#
We use coarse-resolution flood maps from the Aqueduct Flood Hazard Maps dataset to assess qualitatively the change in river flood hazard under climate scenarios. This dataset has a resolution of 30 arc-seconds or 300-750m depending on the latitude (in Europe).
This dataset includes flood maps for extreme flood events in the baseline climate (ca. 1980) and in the future climates (2030, 2050, 2080 for RCP4.5 and RCP8.5 climate scenarios). The methodology behind this dataset is available in the corresponding technical note.
This is a global dataset of riverine flooding which on a local scale may lead to considerable uncertainty in the results. Please keep the following in mind when interpreting the data from this dataset:
The flood maps provide a first indicative estimate and should be interpreted with care.
Results of all scenarios and all models should be consulted before drawing any conclusions on the potential future changes in flood depth.
The underlying hydrological model and flood mapping method have a relatively coarse resolution and thus only include local characteristics up to this level of detail.
Water management, weirs and sluices are not included in the model.
Due to their local nature flash floods are not or not well captured by the flood maps.
The analysis is based on time-series of limited length and thus the extreme value analysis results for high return periods (50 years and higher) carry considerable uncertainty.
Nevertheless, this dataset helps to understand the expected direction of change in flood depth for given return periods. For example, it can help to understand whether fluvial flooding will likely increase or decrease under a given scenario in a given year (e.g. under RCP8.5 in 2050).
Structure of the workflow#
This workflow consists of two parts: hazard assessment and risk assessment. In the next pages you will find:
Hazard assessment (notebook on GitHub) - includes retrieval and plotting of fluvial flood maps for present and future climates, and preprocessing of the hazard dataset that is used as input in the risk assessment.
Risk assessment (notebook on GitHub) - includes the example of calculating economic damages due to flooding based on the high-resolution European flood hazard maps. This notebook can be adapted to use other flood maps that are more tailored to the region of interest (if available).
Outputs of the workflow#
The outputs of this workflow are:
Flood inundation maps for the area of interest for extreme events with different return periods based on European high-resolution dataset.
Comparison of flood depth maps between the future and historical climates under two climate scenarios (RCP4.5 and RCP8.5) for different return periods derived from a coarse-resolution global dataset.
Flood damage maps, expressed in economic value, for extreme events with different return periods based on available flood maps for the historical climate.