Heavy snow and blizzards - workflow for risk assessment under climate change#
This workflow is intended to aid the user in assessing the risks due to heavy snowfall and blizzards. The objective is to understand the probability of severe snowfall and blizzards under the present climate for European regions most impacted by this hazard. Additionally, we seek to investigate how climate change may change this hazard in the future.
Hazard assessment: impact-based indicators#
Blizzards#
A blizzard is a severe storm condition defined by low temperature, sustained wind or frequent wind gusts, and considerable precipitating or blowing snow. To define blizzard conditions, we propose the use of the following impact indicator:
Blizzard days = Tmean ≤ 0 °C and Rs ≥ 10 cm and Wg ≥ 17 m/s , where:
Tmean - mean daily temperature
Rs - amount of snow
Wg - wind gust velocity
This impact indicator was defined taking into account the exposure of critical infrastructure, i.e., roads, rails, power lines, and telecommunication to the hazard, and is based on an extensive literature review, media reports, surveys conducted with European CI operators and case studies ( Vajda et al., 2014).
Heavy snowfall#
Heavy snowfall may cause many disruptions and impacts in various sectors; however, the impacts and consequences of this hazard depend on the affected sector, infrastructure, and also preparedness of society which varies over Europe. For example, already a few centimeters of snow can disrupt road traffic, but doesn’t normally cause any harm to energy infrastructure. Many weather services have three warning levels based on the severity of expected impacts, which are typically different for different sectors of infrastructure. There is a large variation in the national warning criteria or thresholds.
Similarly to blizzards, the impact indicators for heavy snowfall were defined taking into account the exposure of critical infrastructure, i.e., roads, rails, power lines, and telecommunication to the hazard, and is based on an extensive literature review, media reports, surveys conducted with European CI operators and case studies. The qualitative description of the two-level thresholds for daily snowfall amounts are:
1st threshold ( > 6 cm): Some adverse impacts are expected, their severity depends on the resilience of the system, and transportation is mainly affected.
2nd threshold ( > 25 cm): The weather phenomena are so severe that is likely that adverse impact will occur, CI system will be seriously impacted.
Assessing the hazard - annual probability#
This workflow calculates the Annual probability (%) of a blizzard and heavy snowfall days during the specified period for the region of interest.
The annual probability is determined by dividing the count of events surpassing predefined thresholds within a year by the total number of days in that year. The result is then multiplied by 100 to express the probability as a percentage:
P = ((variable > threshold) / days in year ) X 100
Datasets used#
We computed the impact-based indices for heavy snowfall and blizzards using the ERA5 and EURO-CORDEX datasets, which were acquired through the CDS API sourced from the Copernicus Climate Data Store.
Caution
While ERA5 and EURO-CORDEX are valuable datasets for assessing snow and blizzard events, limitations in spatial resolution, representation of extremes, and model uncertainties necessitate the use of local observations and additional high-resolution simulations for accurate snowstorm risk assessment. Applying bias correction techniques and using multi-model ensembles can help mitigate some of these uncertainties.
Risk assessment methodology#
In this workflow, risk is determined as a combination of the probability of occurrence of heavy snow or blizzards (hazard) with population density (exposure). The risk can be assessed for both present and future climate conditions by using the hazard impact-based indicators derived based on climate models.
The method for assessing risk involves visually representing the susceptible population exposed to intense snowfall and blizzards. This can be achieved by overlaying the impact-based indicators for heavy snowfall and blizzards with population data.
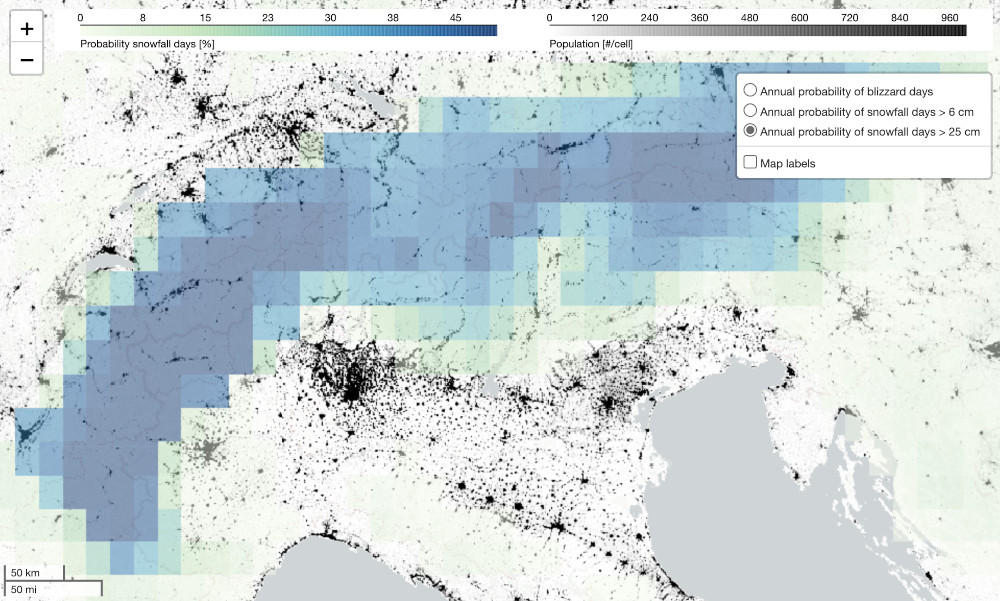
Fig. 37 Snapshot of an interactive map produced by the risk assessment showing annual probability of snowfall days (hazard; colors) overlaid onto population density (exposure; monochrome).#
Exposure - population density#
For assessing population exposure, we relied on the JRC data portal, particularly the Global Human Settlement Layer (GHSL).
Structure of the workflow#
This workflow consists of two scripts, where the user is guided in performing a hazard and risk assessment for heavy snowfall and blizzards.
In the next pages you will find:
Outputs of the workflow#
The examples of probability maps produced in the EU-RAIN project are shown below. These figures show the probabilities of blizzards for past climates, computed from ERA-Interim reanalysis with a horizontal resolution of 0.7°. Changes in annual blizzard probabilities for future climates were computed from a set of six RCMs at a 50 km spatial resolution, produced in EURO-CORDEX for the RCP 8.5 emission scenarios.
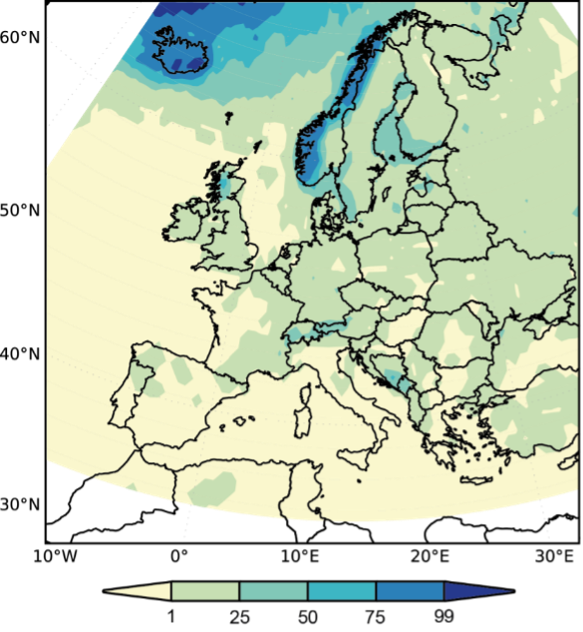
Fig. 38 Annual probability (%) of blizzard during the period 1981-2010 based on ERA-Interim data. (Groenemeijer P. et al. 2016)#
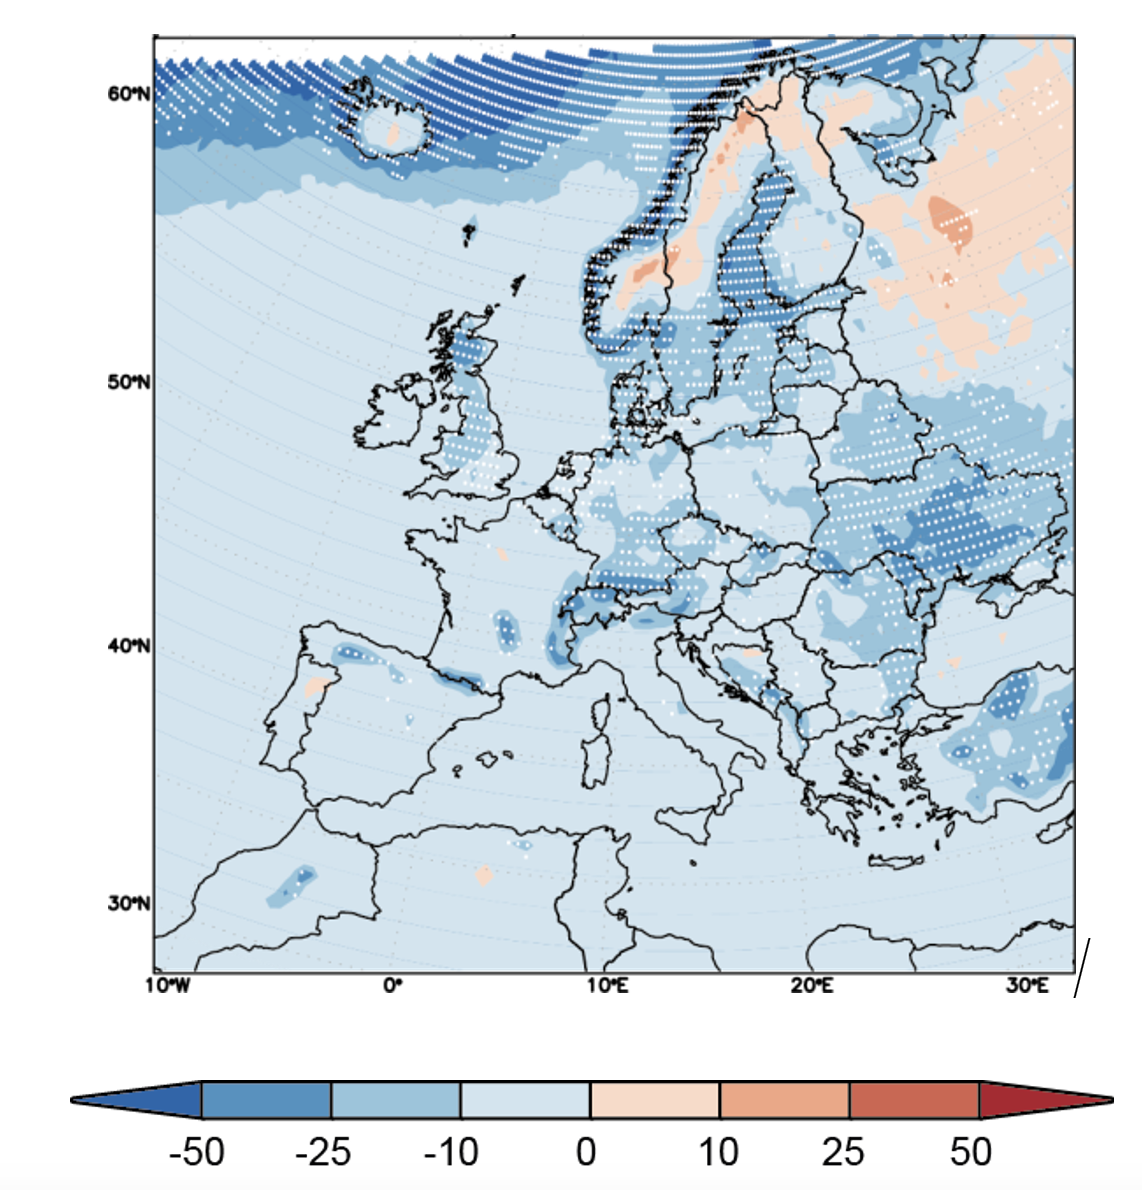
Fig. 39 Multi-model mean change in annual probability of blizzards (in percentage points) by 2071-2100 under the RCP 8.5 scenario; white dots denote significant change at the 95% level of confidence. (Groenemeijer P. et al. 2016)#
References#
Groenemeijer P., Vajda A., Lehtonen I., Kämäräinen M., Venäläinen A., Gregow H., Becker N., Nissen K., Ulbrich U., Morales Nápoles O., Paprotny D., Púčik T., 2016: Present and future probability of meteorological and hydrological hazards in Europe, EU RAIN Deliverable 2.5, http://rain-project.eu/wp-content/uploads/2016/09/D2.5_REPORT_final.pdf
Vajda A., H. Tuomenvirta, I. Juga, P. Nurmi, P. Jokinen, J. Rauhala, 2014: Severe weather affecting European transport systems: the identification, classification and frequencies of events. Nat. Hazards, 72 (2014), pp. 169-188, DOI: 10.1007/s11069-013-0895-4