Model choice, custom scenarios and storylines#
Which climate models should be used?#
A global climate model (GCM) is a mathematical representation of the physical and biogeochemical processes that make up the Earth’s climate. GCMs produce simulations of past, current and future large-scale climates.
GCMs show rising global temperatures with amplified warming in the Arctic, enhancement of the global hydrologic cycle (dry places becoming dryer and wet places becoming wetter), and rising sea level. However, climate models can disagree on many results and projections, especially on a local level analysis. For example, for the near-term future, some models might project significant droughts in a specific region, while another projection might show limited change in the same region. However, both are plausible scenarios. Also, models that perform well in the past do not necessarily provide the ‘best’ projections.
One way to analyse the group of projections from GCMs is by averaging the projections per emission scenario. However, averaging also dampens the change signal. Different climate models project different and sometimes opposite changes in temperature and rainfall patterns, leading to a wide range of plausible outcomes. See the example in Fig. 19 below showing significantly varying flood projections for individual models (see multiple oblique lines) while average projections lead to ‘seemingly’ limited change in flood volumes. You can explore multiple climatic conditions using this example exercise.
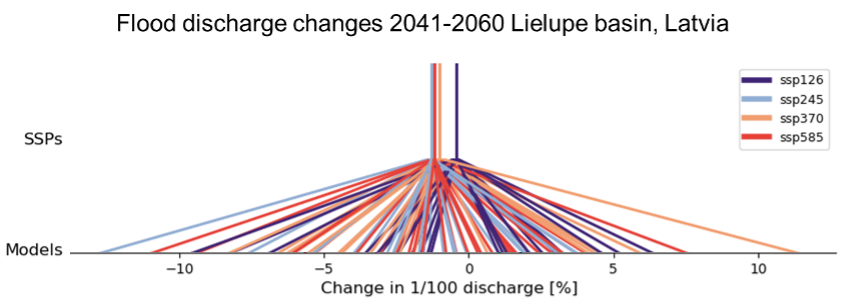
Fig. 19 Changes in 1/100 year return period river discharge for in the Lielupe basin across various climate models. Adapted from Buskop et al. (2024).#
See also
Hazard datasets » Climate model projections
CMIP vs CORDEX: When exploring future climate scenarios, you can use for example CMIP6 or CORDEX data. CMIP6 provides data from the latest global climate model runs (~50–100 km) while CORDEX is a downscaled version of the older CMIP5 data (~12 km), which tries to better capture small-scale variations. CORDEX can, therefore, be more useful for local and regional studies.
Choice of time horizon: A project’s planning horizon is another important consideration. Over relatively short periods (i.e., the next decade), the range of projected climate change between different SSPs is small. However, after the middle of the century, the climate projections for the scenarios quickly diverge, which could result in widely varying impacts between the scenarios. In the latest IPCC report, 2021–2040 is referred to as near term, 2041–2060 as mid-term, and 2081–2100 as long term, relative to 1850–1900, which is used as a proxy for the pre-industrial period.
Note
Current conditions, including yearly variations, as well as variations in the coming decades do not significantly change until the 2050s. Therefore, we do not recommend to focus on the scenarios for the near term. Scenario choice impacts outcomes from the mid-century onwards only.
How to develop your own custom scenarios?#
What makes a scenario useful to take along in the CRA? Here we provide a list of characteristics to keep in mind when developing scenarios:
Relevant: Focus on the specific issue or question you are trying to understand. Provide information and develop indicators that supports targeted decision-making and future planning, rather than being too general or off-topic.
Plausible: Ensure the scenario is realistic and credible, based on facts or logical assumptions. It should represent something that could actually happen, even if it’s a projection about the future.
Consistent: Maintain coherence where all parts fit together logically. Facts and assumptions should align without contradictions, ensuring the scenario makes sense as a whole.
Distinctive: Create scenarios that are unique compared to others. This allows exploration of different possibilities or outcomes, supporting your considerations towards various futures rather than repeating the same ideas.
Guiding questions to help build regionally relevant socioeconomic scenarios
Which societal risk drivers are relevant for your region?
In which ways could these risk drivers change in the future?
How do these changes affect current-day risks?
Practical example: scenario matrix
Here we provide a few simple examples of how one can build up a scenario matrix. The matrix is a versatile tool for examining how different combinations of these drivers could influence risk levels.
Increased Flooding and Urban Expansion: In a given region, imagine two factors contributing to climate risk: increase in flooding due to intensified precipitation events and urban expansion in the flood plain area. Increased flooding combined with additional urban expansion results in a greater risk than either factor alone, leading to a red colour in the upper right part of the drawing below.
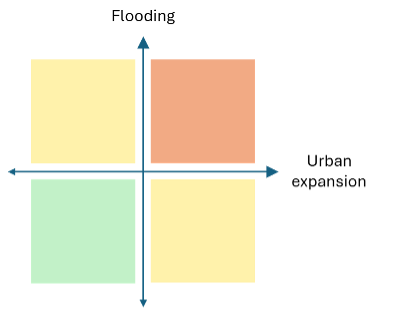
Fig. 20 A two dimensional scenario matrix where combinations of impact drivers can be made to analyse the risk in each scenario (here indicated by the color scheme).#
Dry Spells, population growth and water usage: For this example imagine three factors influencing climate risks: dry spell length, population growth, and water use per person. Increased dry spells coupled with higher water use and population growth in the region can significantly affect water supplies. Even more than if only one factor was present. This is illustrated in Fig. 21 below: the larger arrows indicate a worsening of the climate impact driver.
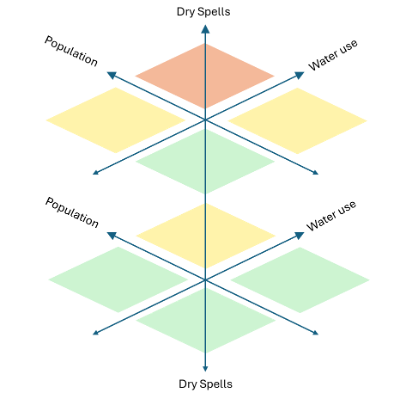
Fig. 21 A three dimensional scenario matrix where combinations of impact drivers can be made to analyze the risk in each scenario (here indicated by the color scheme).#
The scenario matrix helps understanding not only isolated impacts but also how combinations of risk drivers might interact, compound, or even mitigate each other, thereby supporting robust decision-making and adaptation planning across various plausible futures.
Storylines of past events#
We can learn from historical events and how these might impact society if they occur again in a different form. Even before diving into future climates, we can already learn from events in the past as their small scale processes such as intense rainfall episodes are often not available in current climate models. Event-based storylines put emphasis on the qualitative understanding of the driving factors involved and the plausibility of those factors rather than quantitative precision. ‘Storylines as a physically self-consistent unfolding of past events’ (Shepherd et al., 2018) bring together the experiences of how an extreme event was experienced in a descriptive narrative that can be used to be better prepared for the future. The use of past events as baseline for storyline development assures a credible justification for the selection of events and provides highly relevant context of the already experienced risks. Moreover, storylines can help to assess future changes in compound and cascading risks.
Intensification of Events: Data from historical events can be modified to replicate what would happen in a warmer world. One could intensify rainfall events, intensify droughts or hurricanes or consider increased sea level.
Displacement of Events: One way to learn from events is to examine historical events that occurred in other regions but could happen locally due to changing climate patterns or just by randomness of where the event actually occurred.
Consecutive Events: A useful exercise can be to consider the impact of multiple events occurring in succession, such as back-to-back windstorms and flooding or simultaneously such as multiple wildfires in different locations. These can help to identify bottlenecks.