GeoNode Data Upload and Metadata Guide#
Standard rules for naming CRA datasets, uploading them to the CLIMAAX database platform, preparing metadata, and organizing layers in the repository map.
Follow the workflow in four logical steps
Why are we using GeoNode as an upload portal in CLIMAAX?#
Since each region is producing different types of datasets, GeoNode helps the CLIMAAX team to collect everything in one place and avoid scattered files, duplicated uploads, unclear names, or incomplete information. It also allows us to check the uploaded datasets more efficiently and make sure they are linked to the correct workflow, CRA category, metadata, style, and regional map group before the CLIMAAX team uploads them to Zenodo.
Our main objective is to create a cleaner and more homogeneous dataset repository, where it is clear what each dataset represents, how it was produced, and how it relates to the climate risk assessment results.
Before you start: What data should be uploaded?#
If you generated, modified, processed, or adapted a dataset for your project, upload and share it to GeoNode and list it in the Deliverable Platform dataset window.
This includes hazard, exposure, vulnerability, risk, impact, threshold, indicator, IDF, return-period, bias-corrected, reclassified, aggregated, or other derived datasets used to produce your results.
Do not upload large raw public datasets such as ERA5, EURO-CORDEX, CORINE Land Cover, CHELSA, Landsat images, or other original source data. However, if you extracted, clipped, bias-corrected, reclassified, aggregated, or otherwise processed these datasets for your region, the resulting project-specific outputs should be uploaded and shared.
For local input datasets, upload and share them when they are public or have no access restrictions. If a local dataset is restricted, do not upload the raw data; instead, list it in the Deliverable Platform, clearly describe the restriction, and provide a derived, anonymised, or post-processed version whenever possible. If no shareable or post-processed version is provided, the CLIMAAX team will contact you to explore possible alternatives.
Important
At this stage, you do not need to upload datasets to Zenodo yourself! The CLIMAAX team will handle the Zenodo upload process internally for each project, based on the datasets and information provided via GeoNode and the Deliverable Platform.
If you wish to upload supplementary material that is not a dataset, you are still welcome to submit a record to the CLIMAAX Zenodo community.
1 Dataset upload to the CLIMAAX database platform#
Each dataset uploaded to the CLIMAAX database platform should follow the same basic workflow: registration, dataset upload, style upload, metadata completion, and map organization. Consistent upload practice helps keep the repository searchable, clear, and easy to maintain across all CLIMAAX regions.
1.1 Registration#
Before uploading data, create a user account on the CLIMAAX database platform. Click “Register” and complete the registration form.
Field |
Instruction |
|---|---|
Use the email address of the contact person responsible for the upload. |
|
Username |
Use the acronym of the open call project. If more than one account is needed for the same project, follow the format acronym_1, acronym_2, and so on. |
1.2 Dataset upload sequence#
Go to “All resources”.
Click “Add Resource”.
Select “Upload Dataset”.
Click “Select files” and choose the dataset file. The maximum file size accepted is 300 MB.
Finish by clicking “Upload”.
Accepted file formats
ESRI Shapefile (.shp, .shx, .dbf, .prj): The standard vector format needs to be uploaded at once.
GeoPackage (.gpkg): An open, lightweight, and platform-independent spatial format for vector datasets.
GeoTIFF (.tif, .tiff): The standard format for raster data, satellite imagery, and georeferenced maps.
KML / KMZ (.kml, .kmz): Keyhole Markup Language formats used in geospatial mapping and Google Earth.
CSV (.csv): Comma-separated value files containing spatial coordinates (latitude/longitude) or tabular spatial attributes.
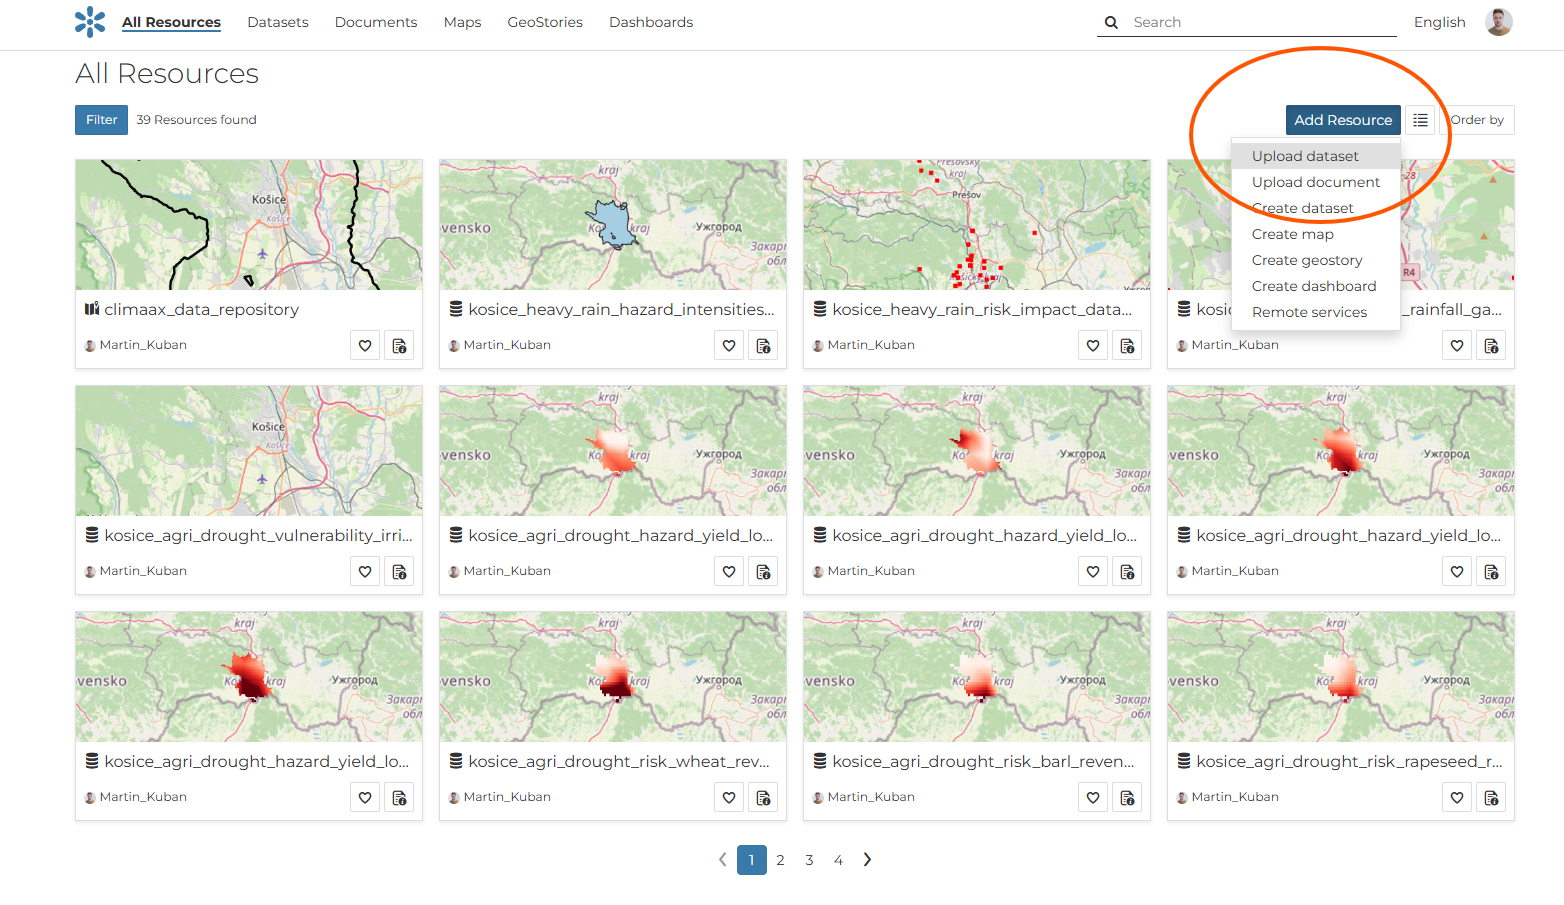
Fig. 41 Open the “All resources” page and choose “Add Resource” → “Upload Dataset”.#
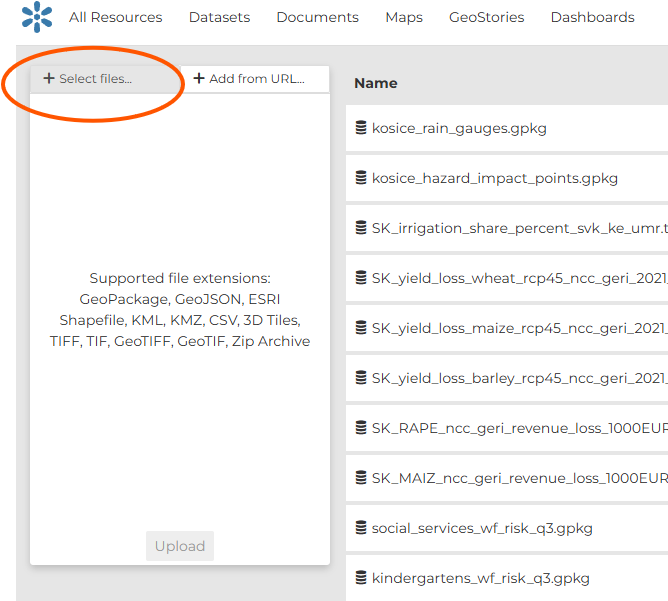
Fig. 42 Click “Select files”, choose the dataset, and complete the upload.#
2 SLD Style Upload and Assignment#
To ensure that uploaded datasets are displayed correctly and consistently in GeoNode, each layer should have an associated .sld style file whenever possible.
The SLD file defines how the layer will be visualized, including colors, line widths, symbols, class ranges, labels, and transparency.
This is especially important for CLIMAAX datasets, because many layers represent hazard, exposure, vulnerability, or risk categories that should be shown in a standardized way across regions.
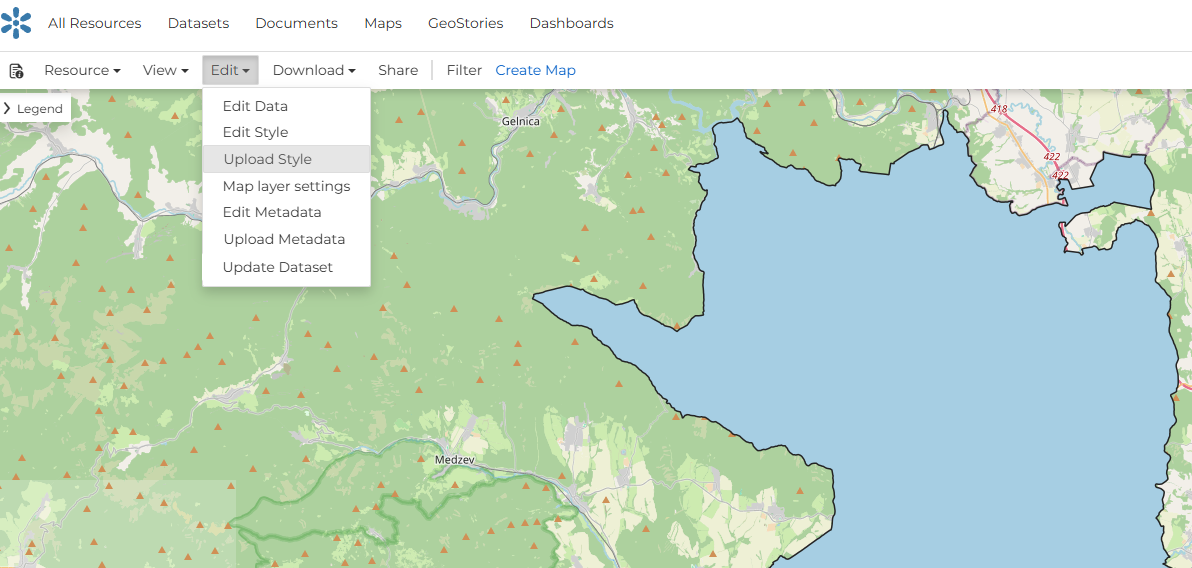
Fig. 43 Click on “Edit” and select “Upload Style”.#
2.1 What is an SLD file?#
An SLD (Styled Layer Descriptor) is a style file used by GeoServer and GeoNode to define the visual appearance of spatial layers. It can be used for both vector and raster data.
Typical uses of SLD styles in the CLIMAAX repository include:
classified hazard maps,
raster color scales,
point symbols for infrastructure or event locations,
line styling for roads, rivers, or boundaries,
transparency settings for background or non-relevant classes.
2.2 Preparing the SLD file before upload#
Before uploading the style, check that the SLD file matches the dataset correctly.
The following points are essential:
the attribute names used in the SLD must be exactly the same as in the uploaded layer,
the value ranges or class names in the style must correspond to the layer data,
the geometry type must match the dataset type (point, line, polygon, or raster),
the style should be tested in QGIS or GeoServer before upload when possible,
the style name should follow a clear naming convention.
Recommendation
The .sld style file may be prepared in GIS software environments such as QGIS (instructions), where the desired symbology can be defined and exported.
ArcGIS style files can be converted to the .sld format (Python tool).
Alternatively, it may be created by manually following the essential SLD structure and styling rules.
The use of AI assistance may also help with the preparation of simple style files.
In all cases, the final style should be validated before upload to ensure full compatibility with the dataset and correct visualization in GeoNode.
3 Metadata preparation#
Note
This section starts with a detailed explanation of the dataset title convention, which is part of the metadata in “Title” window. It is then followed by the other mandatory and optional metadata structures.
Each dataset uploaded to the CLIMAAX database platform should have metadata prepared in a consistent way. The metadata should explain what the dataset contains, where it applies, how it was produced, which workflow it belongs to, and how it should be classified within the climate risk assessment structure.
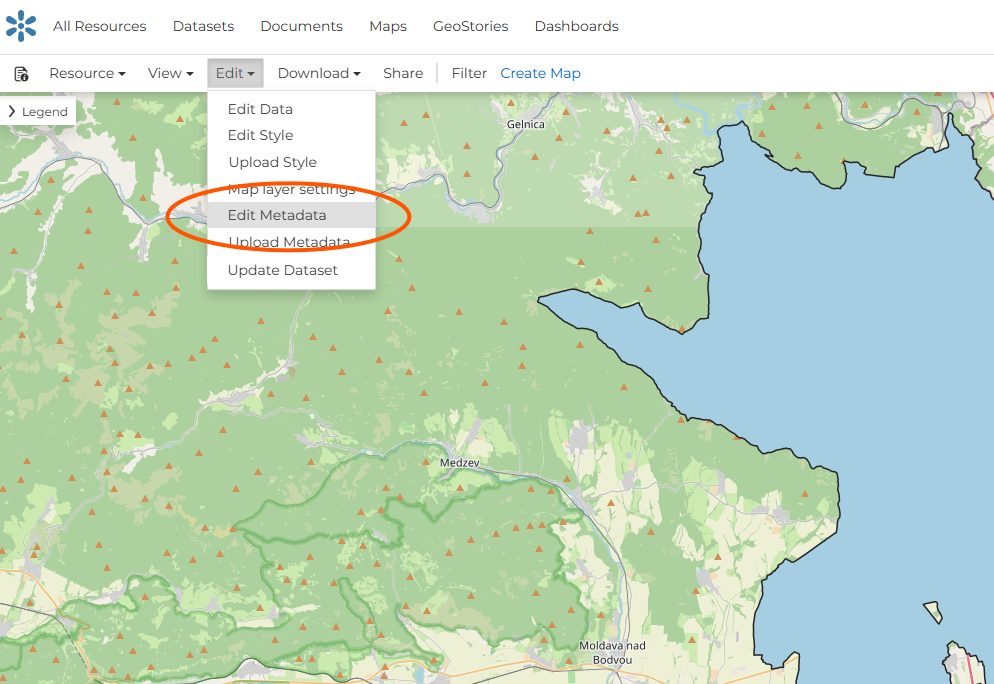
Fig. 44 Open dataset, “Edit” and select “Edit Metadata”.#
3.1 Dataset title#
The Dataset title is the first part of the metadata in “Title” window. Make sure the filename follows the agreed CLIMAAX naming convention, described bellow. The dataset title is the basis for the metadata structure, because it provides the key information needed to identify the region, workflow, category, variable, climate scenario, model information, and represented time period.
The most important parts of the title naming are the first four elements:
Region
Workflow
Category
Variable
For the other title elements, it is recommended to use abbreviations and describe them in the metadata, because extremely long names can cause problems during data upload:
Use lowercase letters and underscores between words.
Avoid very long names.
Avoid special characters such as quotation marks, question marks, accents, or national characters that may cause upload problems.
Keep the filename consistent with the agreed CLIMAAX naming convention.
The dataset title is filled in the “Title” metadata window.
Use the following structure_ mandatory_part_and_optional_but_strongly_encouraged.
(region)_(workflow)_(category)_(variable)_(rcp)_(gcm)_(rcm)_(time_period)_(data_type)
Example:
kosice_agri_drought_hazard_yield_loss_rapeseed_rcp45_ncc_geri_2021_2050_raster
Element |
Instruction |
|---|---|
region |
Name of the region |
workflow |
One of the CLIMAAX workflows, in this form:
|
category |
One of the four CRA categories:
|
variable |
The variable represented by the dataset |
Element |
Instruction |
|---|---|
rcp |
Climate scenario, if relevant. |
gcm |
Global climate model shortcut, if relevant. |
rcm |
Regional climate model shortcut, if relevant. |
time_period |
Represented time period, for example |
data_type |
Like: |
3.2 Distinguish the categories#
To be sure that the CRA categories will be selected correctly in the metadata dropdown windows please read the detailed explanation in the table below or look at the UNDRR webpages:
Category |
Explanation |
|---|---|
Hazard |
A process, phenomenon or human activity that may cause loss of life, injury or other health impacts, property damage, social and economic disruption or environmental degradation. Hazards may be natural, anthropogenic or socionatural in origin. |
Exposure |
The situation of people, infrastructure, housing, production capacities and other tangible human assets located in hazard-prone areas. In the Risk Data Hub (RDH), the computation of the exposure comes from the intersection (overlap) of the hazard with assets. The presence of the assets in the “footprint” of the hazard is considered exposure. The units are dependent on the type and input data of the assets (e.g. the population affected by a hazard is expressed as a number of people while the built infrastructure exposed might be expressed as square meters (sqm) affected). Results from the exposure calculation are then aggregated at different administrative levels. 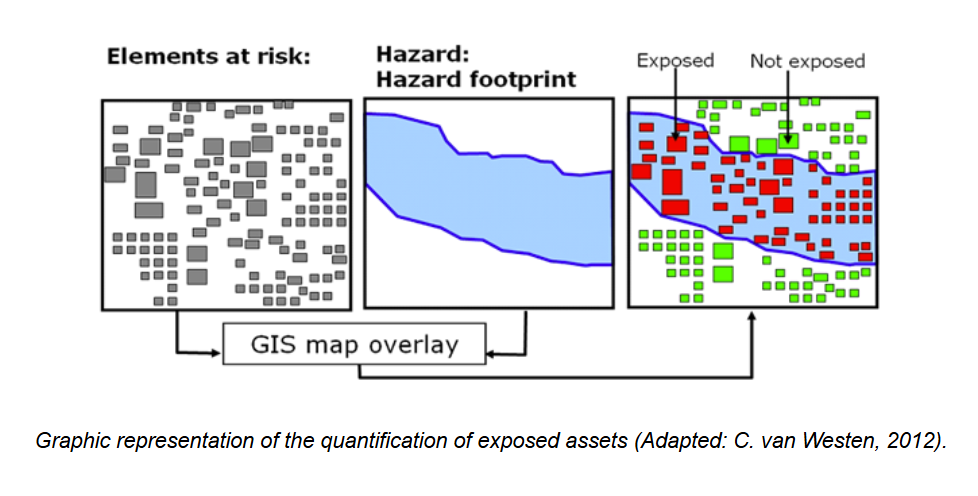
|
Vulnerability |
The conditions determined by physical, social, economic and environmental factors or processes which increase the susceptibility of an individual, a community, assets or systems to the impacts of hazards. Reducing vulnerability presents a significant opportunity for mitigating disaster risk, given our inability to decrease the occurrence and severity of natural hazards. The vulnerability framework in the Risk Data Hub (RDH) introduces a cross-scale indicator for measuring vulnerability at the European level. This indicator is composed of five dimensions (social, economic, political, environmental and physical) and is meant to capture the systemic vulnerability to disasters across different administrative levels (Country, NUTS2 and NUTS3). |
Risk |
The combined result of hazard, exposure, and vulnerability, or the resulting impacts or losses |
3.3 Metadata fields and how to fill them#
The other metadata windows are provided as dropdown fields. Guidance on how to select the appropriate options is provided in the tables below. The fields highlighted in orange are mandatory, while the fields highlighted in blue are optional but strongly encouraged.
Field |
Instruction or drop down |
Information (in pop up window) |
|---|---|---|
UUID |
Automatically generated by GeoNode during upload. |
GeoNode identification number. |
Title |
Use the name of the layer. The title should match the uploaded dataset name. |
Name of the dataset |
Date |
Automatically generated by GeoNode as the date of upload. |
Date of the upload |
Risk Workflow |
|
Based on the selected CLIMAAX workflow. If unsure, please refer to the upload manual for guidance. |
CRA category |
|
If unsure, please refer to the upload manual for guidance. |
Hazard type (if hazard) |
|
Select if its Hazard else select “Not related”. UNDRR hazard type specification. If unsure, please refer to the upload manual for guidance. |
Exposure type (if exposure) |
|
Select if its Exposure else select “Not related”. Exposure types describe what may be affected by a climate-related hazard. |
Vulnerability type (if vulnerability) |
|
Select if its Vulnerability else select “Not related”. Vulnerability types describe the characteristics or conditions that make people, assets, infrastructure, or systems more sensitive to climate-related hazards or less able to cope with their impacts. |
Regions (rename to “Country”) |
Fill according to the geographic coverage of the dataset. |
Example: Slovakia |
NUTS2 ID |
|
|
Contacts |
Use the CLIMAAX open call project acronym for the region or project. Fill the required GeoNode contact roles with the same acronym. |
Fill Owner, Metadata Author, and Point of Contact with the project acronym. Example for Košice: scope. |
Field |
Instruction or drop down |
Information (in pop up window) |
|---|---|---|
CRS (coordinate system) |
e.g. EPSG:4326 |
|
Spatial resolution |
e.g. 10x10m |
|
Temporal Extent Start |
Use date format YYYY-MM-DD. |
|
Temporal Extent End |
Use date format YYYY-MM-DD. |
|
Spatial Representation Type |
|
Depends on the dataset |
Run |
|
Climate scenario describes the future climate pathway used in the dataset. Users should select the RCP or SSP scenario that was applied in the climate model, risk assessment, or hazard analysis. If the dataset is based on current or historical conditions, “Historical” or “Not applicable” should be selected. |
Global Climate Model |
|
Based on the global climate model used in the workflow |
Regional Climate Model |
|
Based on the regional climate model used in the workflow |
Supplemental information |
Provide a short and clear description of the dataset using a standard template. |
Example: This raster dataset presents agricultural drought hazard for the Košice region, expressed as projected rapeseed yield loss under the RCP 4.5 climate scenario for the period 2021–2050. The dataset was produced within the CLIMAAX agricultural drought workflow and is intended to support climate risk assessment and adaptation planning. |
4 Add uploaded datasets to the repository map and create subgroups#
After the dataset and metadata are uploaded, the layer can be added to your region map. Select “Maps” and create a “New” map for your region. Open the map and use the layer panel to build a clear structure for your region.
Important
For the name of the map use the name of the region which you used for your dataset naming!
E.g., for kosice_heatwaves_hazard_lst_2021_2025.tif use the name of the map: kosice.
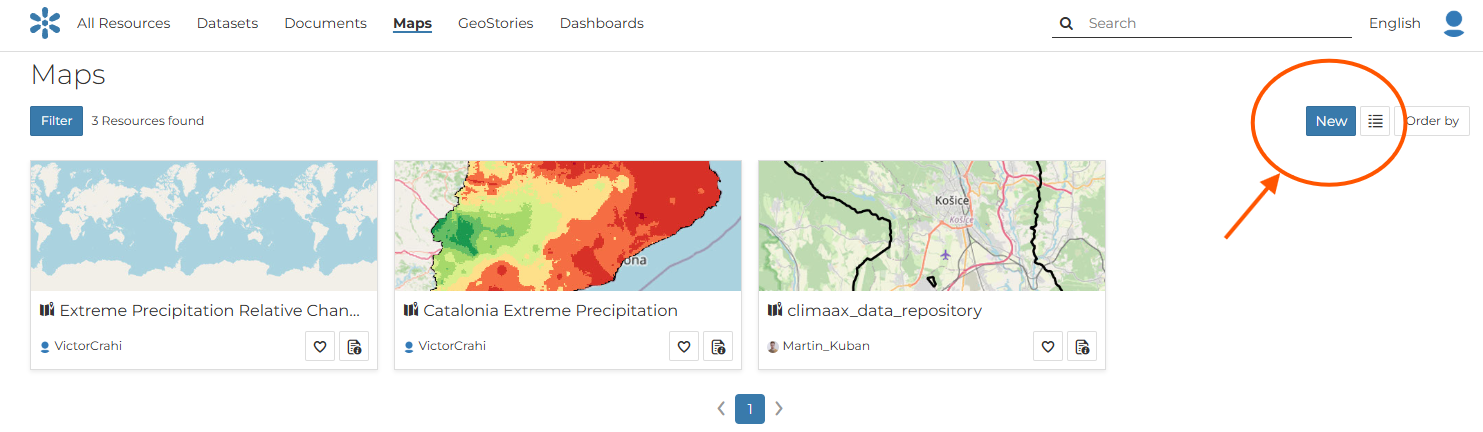
Fig. 45 Creation of the Map for your region#
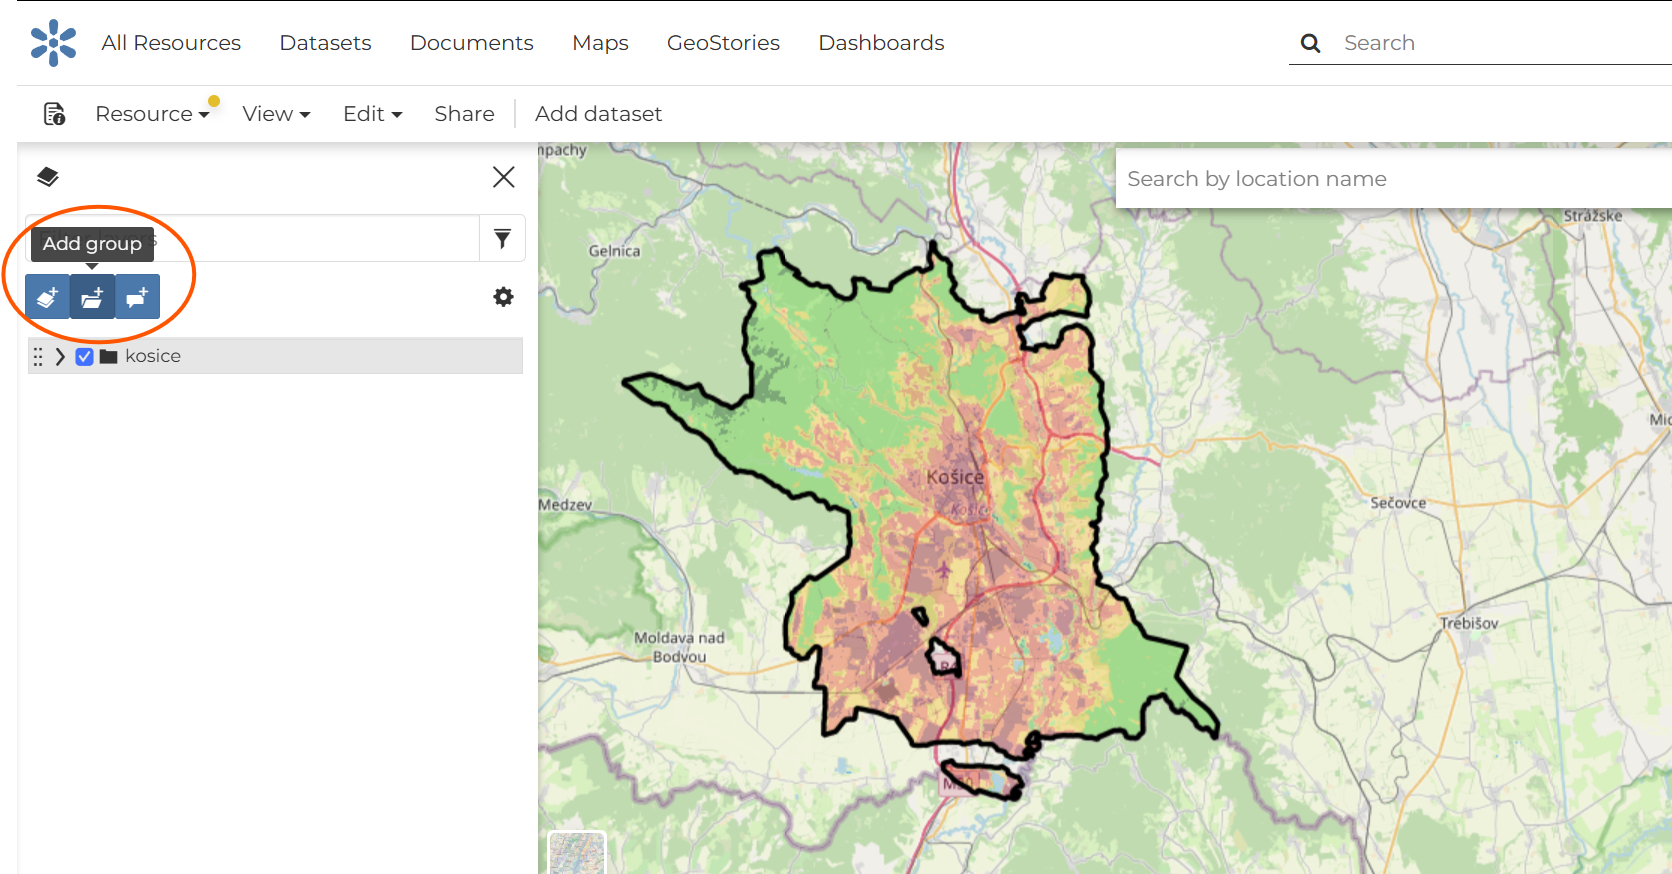
Fig. 46 Use “Add group” to create the main group for your region.#
4.1 Create the regional group#
The main group name should be the name of the region or area selected for the project. Keep all words in lowercase.
4.2 Create workflow and CRA category subgroups#
After selecting the created group, use “Add subgroup to the selected layer” to build subgroups for each workflow and for the CRA categories hazard, exposure, vulnerability, and risk.
Structure level |
Instruction |
|---|---|
Region group |
Create one main group for the region or project area, then create subgroups below it for each workflow and for hazard, exposure, vulnerability, and risk outputs. |
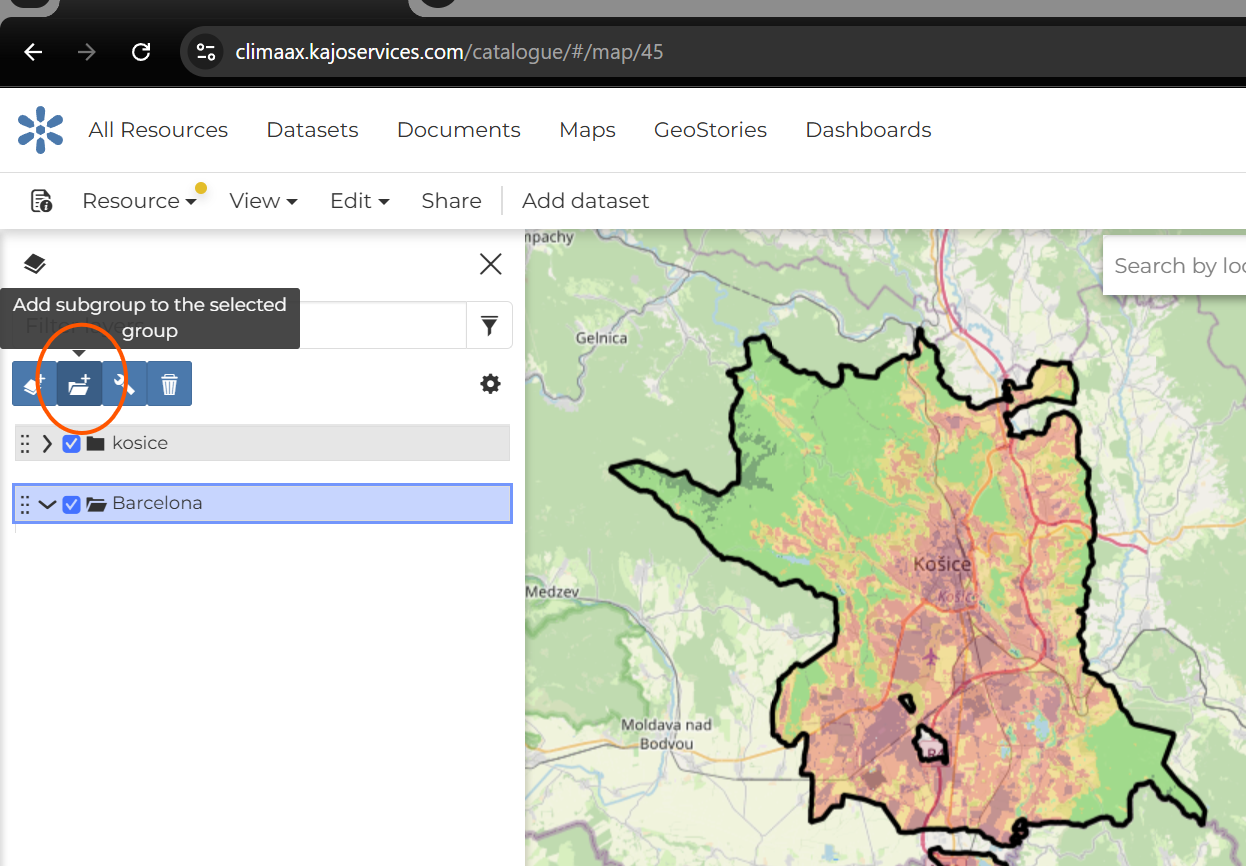
Fig. 47 Add subgroups under the selected regional group.#
When the group and subgroup structure is ready, continue with “Add dataset”. The dataset catalog will open on the right side. By clicking on a dataset, it is added to the map automatically. The layer will also appear in the layer panel on the left, where it can be moved into the correct subgroup by drag and drop.
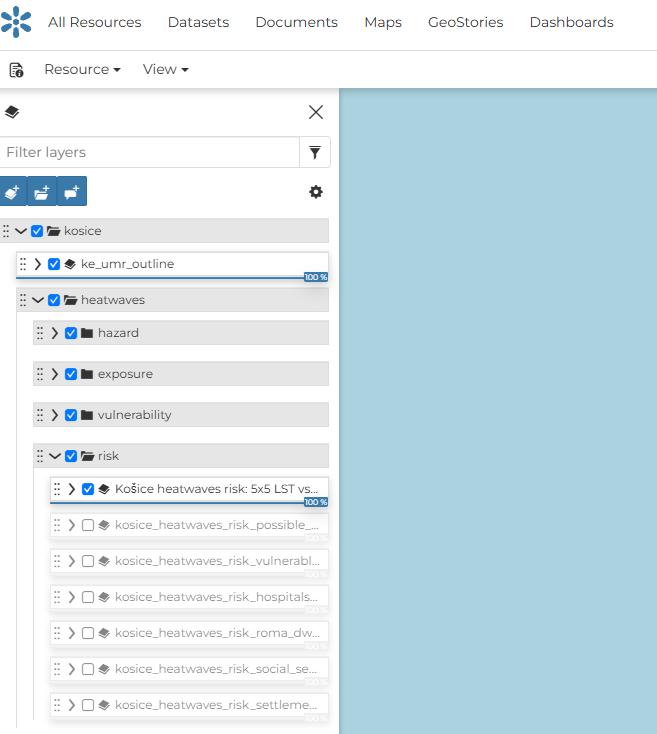
Fig. 48 Example of the prepared regional group in the layer panel.#